A spinner that never ends can be a missing API, a rejected request, a JavaScript exception, or the wrong dev server. The screen alone rarely identifies which. Collect one reproduction and the browser's runtime evidence before asking an agent to rewrite UI code.
Reproduce one action on a known checkout
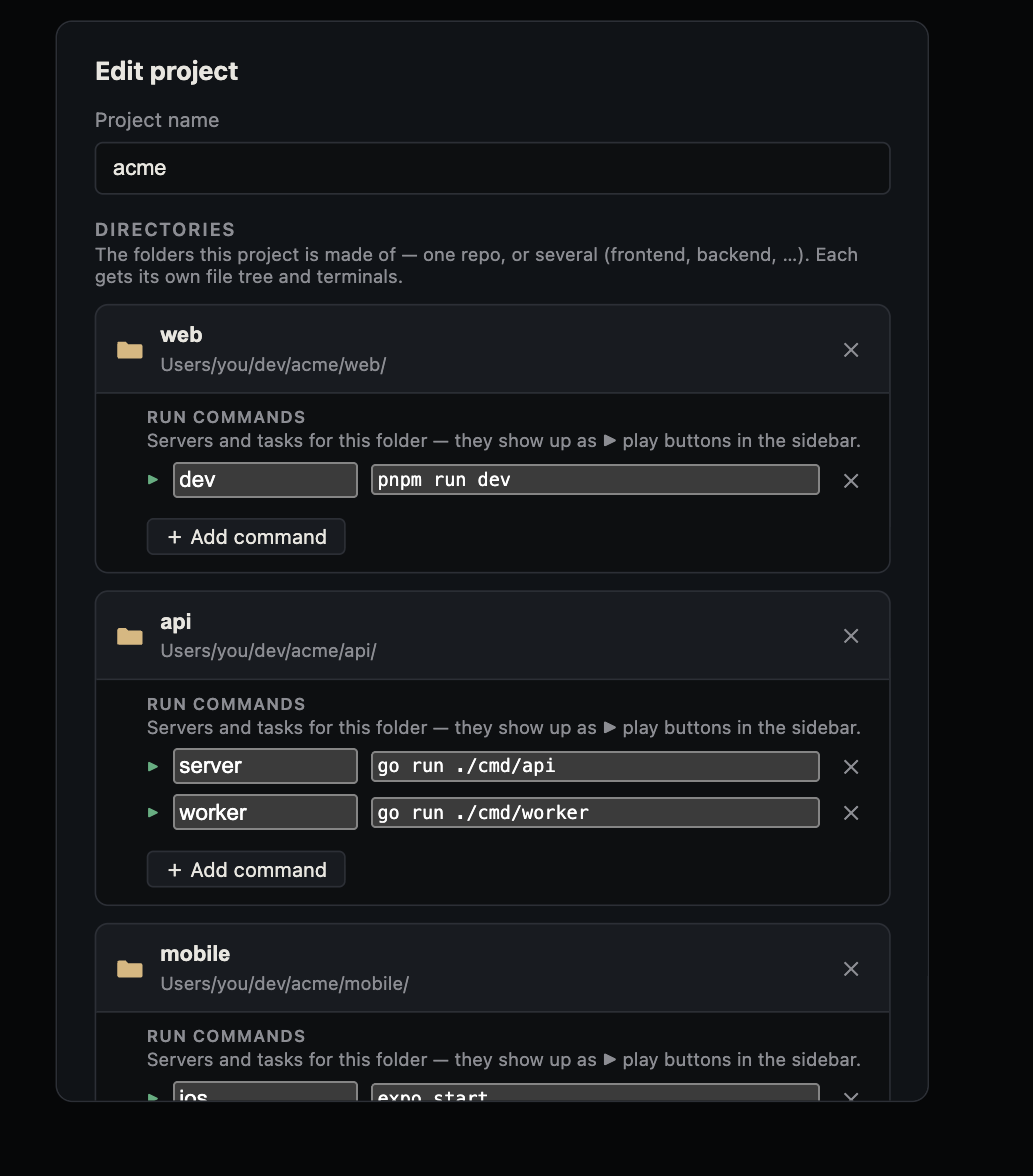
Record the page URL, branch, component, and steps from a fresh load to the failure. In Canopy, verify the website and API processes in Servers and open the detected URL in Preview. A service may be running from another worktree or on another port, so compare its output with the checkout being edited. The current-main Canopy README describes preview, console, and network inspection; confirm the controls in your installed release.
Read the console message as a clue
Copy the first relevant error with its timestamp, file or stack location, and the action that triggered it. A JavaScript exception may stop a click handler before a request is sent. A console 404 can point to a missing asset or endpoint. A CORS message points to a cross-origin boundary but still needs the matching request details. Chrome's DevTools documentation explains these categories; the message is a starting clue, not a diagnosis on its own. Avoid copying unrelated extension warnings or private tokens into an agent prompt.
Inspect the request that matches the symptom
In the Network view, filter to the request made when you repeated the action. Record its method, URL path, status, timing, and a short safe excerpt of the response. A 404 suggests a route or proxy mismatch; a 401 or 403 suggests an auth boundary; a 500 points to server-side failure; and a request that never appears suggests the browser code failed before sending it. These are investigation branches, not automatic fixes. Chrome documents that the Network panel distinguishes HTTP status, CORS errors, blocked requests, and transport failures.
Match browser evidence to the right service log
A failing request to the API should be checked against the API process and its log, not only the frontend build output. If the browser shows a 500, look for the matching time and route in server output. If it shows a connection failure, verify that the service started and reported the expected port. If the response is 200 but the UI still fails, inspect the returned shape and the browser exception without assuming the server is correct. Keep secrets, full authorization headers, and personal data out of shared logs or screenshots.
Give the agent a bounded failure report
Send the reproduction, exact observed evidence, expected result, and the relevant component. Ask the agent to identify the cause before editing, make one scoped change, restart the affected service, and repeat the same action. Review the final diff and the running page after the fix. If no request or console message is available, say so explicitly instead of inventing one; the agent can propose the next observation.
Copyable resources
Browser failure report
Remove credentials and personal data before sharing logs or screenshots.
Checkout/branch and component: [ ]
Page URL and viewport: [ ]
Steps to reproduce: [ ]
Expected result: [ ]
Actual result: [ ]
First relevant console message, file, and time: [ ]
Matching network method/path/status or no request observed: [ ]
Matching service log line or no log observed: [ ]
Please diagnose before editing, make a scoped fix, rerun the app, repeat these steps, and report the final diff and checks run.
Frequently asked questions
A request returned 200. Can the page still be broken?
Yes. The response may contain unexpected data, or JavaScript may fail while rendering it. Compare the response shape and browser error with the expected behavior.
What if the Network view shows no request?
Check whether the action fired and whether an earlier JavaScript error stopped it. Also confirm you are viewing the intended page and checkout.
Should I paste the entire console log into an agent prompt?
Usually no. Share the first relevant error, matching request, and short service excerpt. Remove secrets and personal data.